
Local preview using the live theme CSS. Header and footer omitted. Yellow = placeholder to replace.
IRCE > Grants > SECURE-Nigeria > DAVT

SECURE-Nigeria: DAVT

← SECURE-Nigeria overview
On this page
Completed SECURE-Nigeria sub-project

Data Analytics and Visualisation Tool (DAVT)

The Data Analytics and Visualisation Tool (DAVT) turns Nigeria’s disease surveillance data into ready-to-use information, so that teams from local government areas up to national emergency operations centres can see what is happening and act quickly.

DAVT is a web-based analytics platform developed by the Nigeria Centre for Disease Control and Prevention (NCDC) and the Institute of Human Virology Nigeria (IHVN) under SECURE-Nigeria, with funding and technical assistance from the United States Centers for Disease Control and Prevention (US CDC).

It pulls disease reports in real time from SORMAS, Nigeria’s national disease reporting system, and from other sources. It shows them as interactive charts and maps, and on a live wallboard for situation rooms. It has three areas: routine disease surveillance, vaccine safety, and sentinel surveillance.

DAVT was launched in September 2022 by the then NCDC Director General, Dr Ifedayo Adetifa. It was first built and deployed in the Public Health Emergency Operations Centres of the six states supported by IHVN: Bauchi, Edo, Enugu, Kaduna, Lagos and Ondo. In January 2024, with NCDC, DAVT was expanded to all 36 states and the Federal Capital Territory.

Visit DAVT at ncdcdavt.org.ng →
DAVT is used by authorised NCDC and state staff. You need an account to sign in.

37States using DAVT since January 2024, up from 6 at first deployment
10Analysis tools (modules) in the platform
5Data sources and national systems connected to DAVT
WeeklyNCDC’s Weekly Epidemiological Report is now generated automatically

The challenge

Before DAVT, NCDC’s Weekly Epidemiological Report, its official weekly summary of disease outbreaks, was compiled by hand. It was often late and prone to error. There was no single place to see outbreaks as they developed. Decisions taken in response to alerts were recorded manually, and there was no automatic way to check SORMAS data against other sources, or to keep reporting going when SORMAS was unavailable.

Next: What we did →

What we did

Designed with its users

Design workshops with NCDC, State Ministries of Health and emergency operations centres shaped a platform with separate views for national, state and local government users.

Connected the data

Built a single database with a live connection to SORMAS, plus imports of weekly summary reports and state line lists (spreadsheets that list individual cases).

Brought vaccine safety data together

Connected DHIS2 at the National Primary Health Care Development Agency and the MedSafety app at the National Agency for Food and Drug Administration and Control, so reports of side effects after vaccination can be compared in one place.

Automated the weekly report

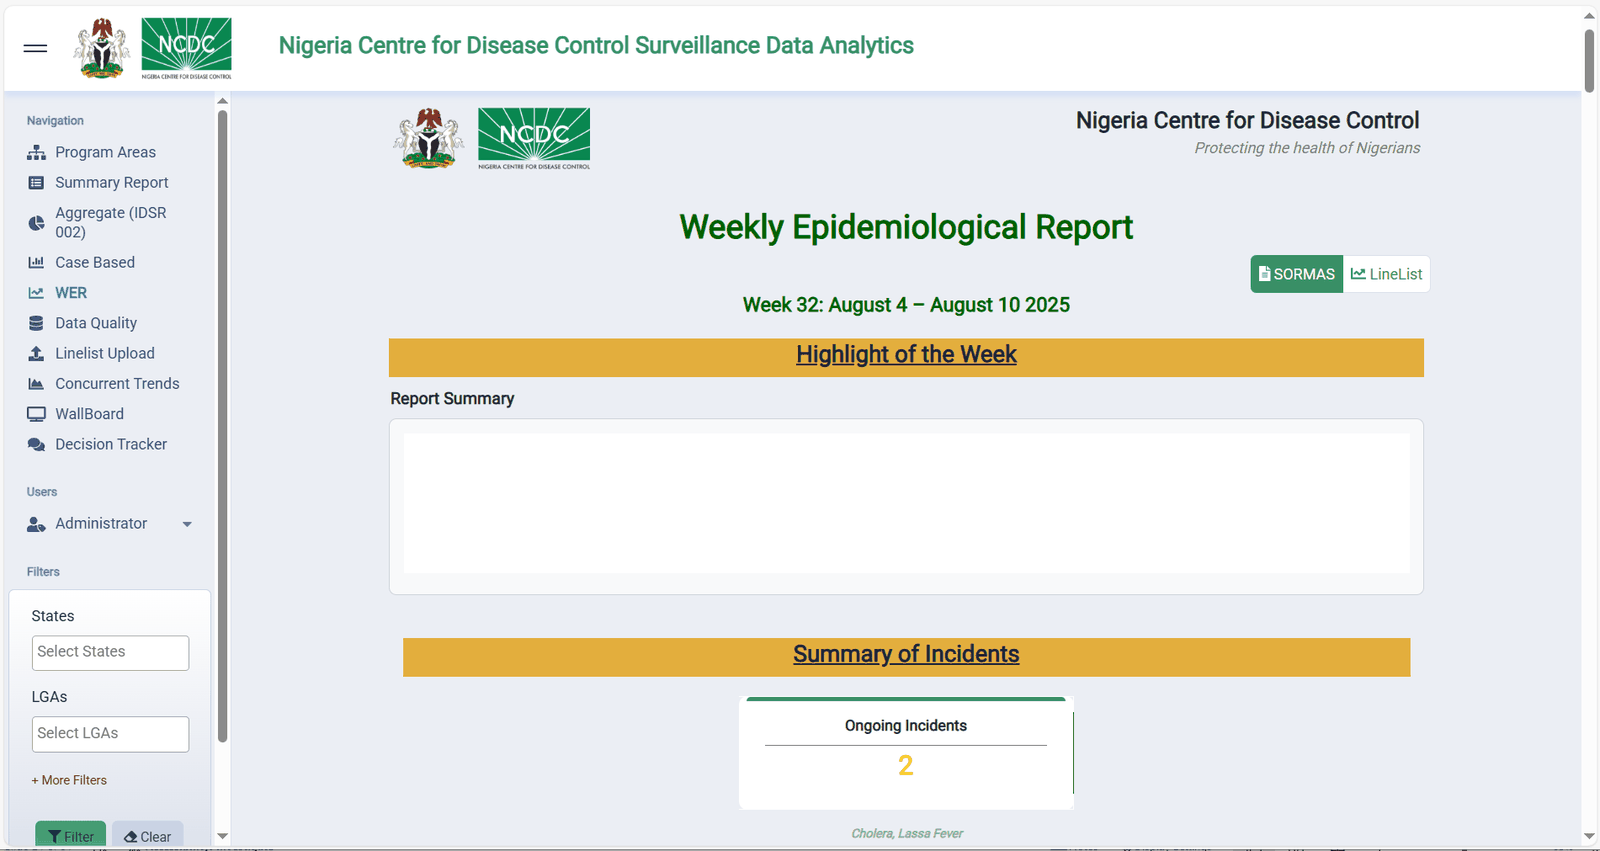
The Weekly Epidemiological Report is now produced directly from live data and can be exported as PDF or Excel, removing manual compilation and date errors.

Kept reporting going during outages

Users can upload state line lists and switch between SORMAS and line-list data, so analysis continues if SORMAS or the internet connection is down, and the two sources can be compared side by side.

Built in data quality checks

A data quality tool scores how complete records are, detects missing information and flags errors automatically.

Made it faster

Improved data processing so that dashboards and the wallboard load more quickly.

Handed it over to NCDC

Prepared a strategy for sustaining, developing and maintaining the platform, a plan for moving it to NCDC’s infrastructure, and technical training for NCDC software developers.

Next: Inside DAVT →

Inside DAVT

Summary report

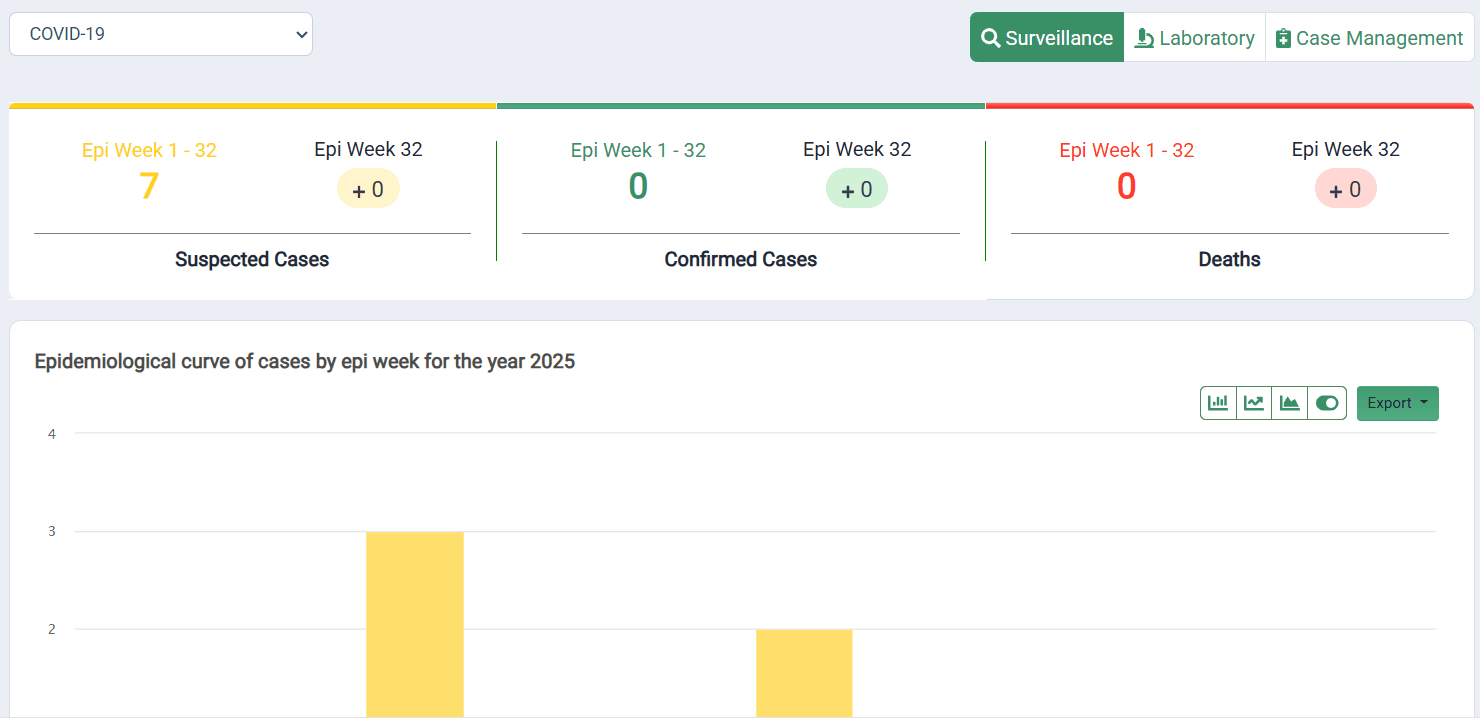
A snapshot of national surveillance: case counts, epidemic curves and trends in the share of cases who die.

Aggregate reports

Weekly summary reports from health facilities, comparing expected and received reports by state and local government area.

Case-based analytics

Detailed analysis of individual cases for each disease, grouped into surveillance, laboratory and case management views.

Weekly Epidemiological Report

The official weekly outbreak report, generated from live data with alerts, highlights and trends.

Data quality

Scores showing how complete records are, with automatic checks for missing or inconsistent information.

Line-list upload

Upload and check state spreadsheets of individual cases using a standard template.

Concurrent trends

Compare SORMAS with state line lists over time to find cases missing from either source.

Data triangulation

Check completeness and agreement between SORMAS and other data sources.

Wallboard

An automatically rotating live display for situation rooms and emergency operations centres.

Decision tracker

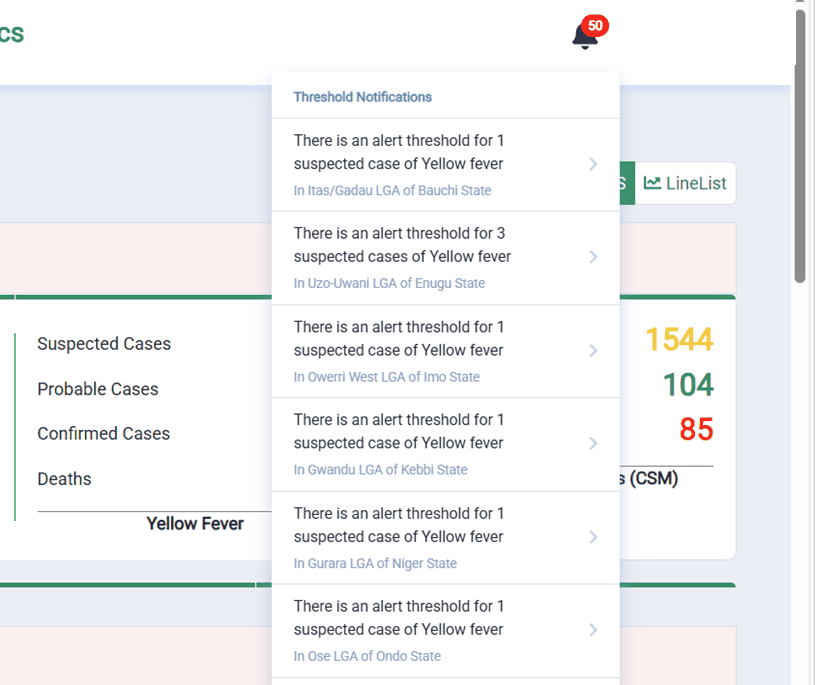
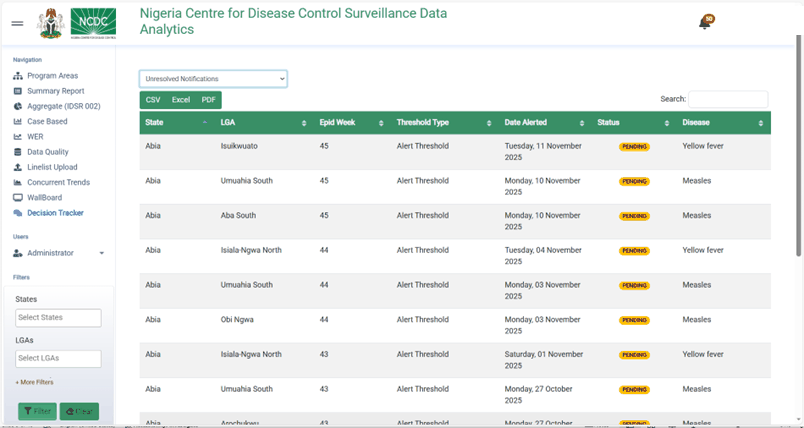
Records every action taken in response to an alert, with a full history, until it is resolved.

Next: Data triangulation →

Data triangulation

Data triangulation means comparing the same information from more than one source to check that it is complete and consistent, and to build a more reliable picture than any single source gives. It is central to how DAVT works.

No single surveillance system tells the whole story. During outbreaks, NCDC’s disease technical working groups kept their own line lists (spreadsheets of individual cases) that combined state reports with laboratory results, because SORMAS alone was not complete enough. DAVT brings these sources together so that gaps show up automatically instead of being found by hand.

Sources DAVT brings together

SORMAS case records

Individual cases of epidemic-prone diseases, received in real time through the SORMAS API: suspected, probable and confirmed cases and deaths.

Weekly summary reports

IDSR-002 aggregate reports from health facilities, used to check that expected reports arrive and match case counts.

State line lists

Spreadsheets of individual cases uploaded by states using a standard template, checked on upload.

Vaccine safety reports

Reports of health problems after vaccination from four channels: the call-in system, state line lists, DHIS2 at NPHCDA and the MedSafety app at NAFDAC (see below).

How DAVT triangulates the data

  1. Bring in

    Records arrive from SORMAS through the API, and states upload line lists using a standard template.

  2. Check

    Each upload is validated: missing key details, wrong formats and illogical dates are flagged before the data is used.

  3. Match

    Cases are compared across sources for the same disease, place and week.

  4. Compare

    DAVT calculates completeness (how many line-list cases are also in SORMAS) and agreement between sources, and flags differences.

  5. Act

    Teams see where records are missing and follow up; data quality reviews track improvement month by month.

What users can see

Concurrent trends

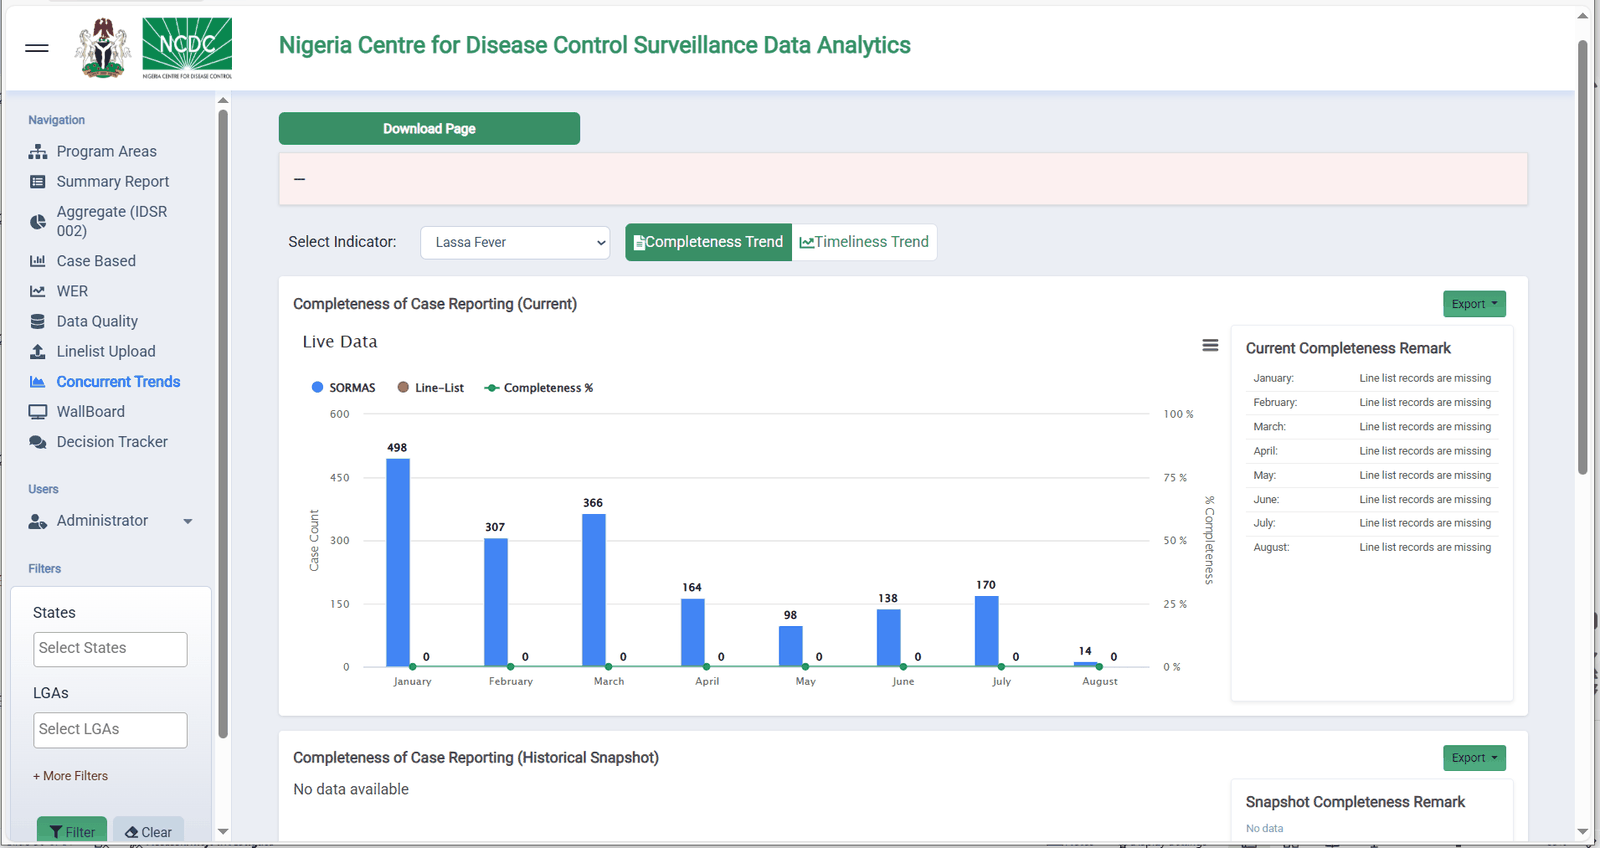
SORMAS and line-list case counts side by side, month by month, with remarks such as “line list records are missing” or “more in SORMAS than on the line list”.

Completeness and timeliness trends

How completely and how quickly each disease is reported in SORMAS compared with the line list, now and over time.

Switching data source

Every analysis can run on SORMAS data or on the uploaded line list, so reporting continues if SORMAS or the connection is down.

Data quality scorecards

Completeness of key details such as age, sex and occupation, and consistency checks across sources.

DAVT chart comparing monthly Lassa fever cases in SORMAS with cases in the state line list
Concurrent trends for Lassa fever: SORMAS and line-list counts compared month by month, with a completeness line and remarks for each month.
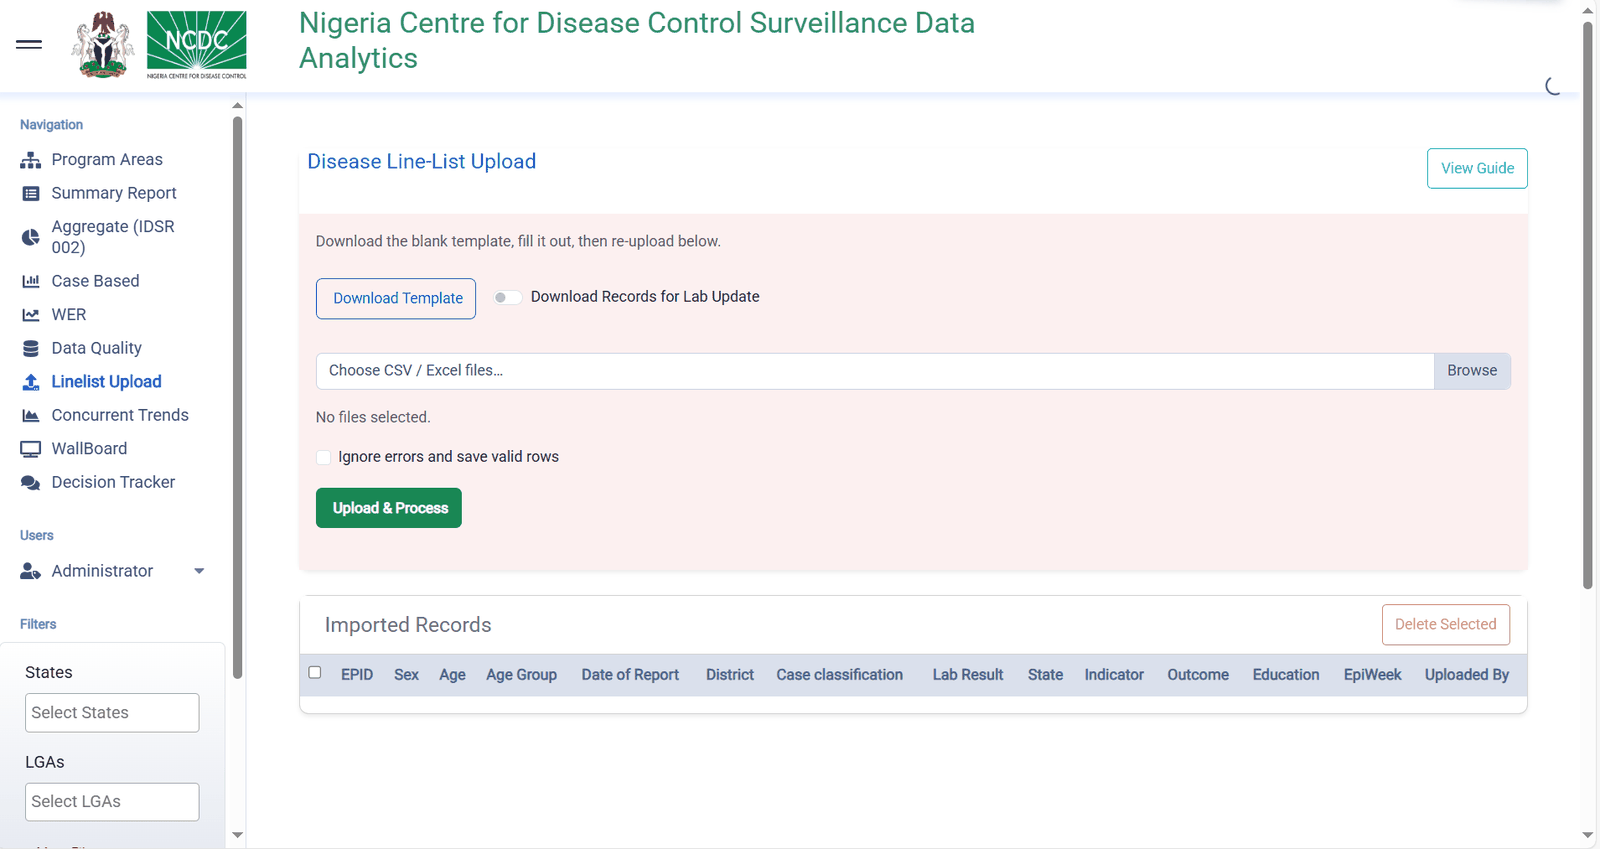
DAVT page for uploading a disease line list from a spreadsheet
Line-list upload: states add their spreadsheets using a standard template, and DAVT validates them before they are compared with SORMAS.

Triangulating vaccine safety data (AEFI)

Reports of health problems after COVID-19 vaccination (adverse events following immunisation, AEFI) reached the government through four separate channels. DAVT’s vaccine safety area brings them together into one triangulated dataset, and lets users look at each source on its own or at all of them combined.

  • Call-in data

    Reports phoned in by health workers to the national call-in system run by NPHCDA with WHO Nigeria.

  • Line list data

    Case-by-case lists compiled by disease surveillance and notification officers in the states.

  • DHIS2 data

    AEFI reports entered in the District Health Information System (DHIS2) at NPHCDA.

  • MedSafety data

    Reports submitted through NAFDAC’s MedSafety app by health workers and members of the public.

Triangulated data

One combined dataset. Reports from every channel are compared and brought together, so the national picture draws on all of them and differences between systems show up.

In DAVT, users choose the view they need: Triangulated data, Call-in data, Line list data, MedSafety data or DHIS2 data.

  • The national COVID-19 vaccination technical working group got one picture of vaccine safety, with indicators based on World Health Organization guidance.
  • Each channel can be checked against the others, showing where reports are missing or delayed.
  • The work is described on the COVID-19 Vaccine Safety Surveillance (AEFI) page and in a BMJ Global Health paper (2023).

Why it matters

  • Gaps between paper and electronic reporting become visible for every disease and state, which is what the Surveillance Data Quality Management reviews act on.
  • Decision-makers can see how far to trust a number before acting on it.
  • For vaccine safety, reports held in separate NPHCDA and NAFDAC systems can be compared in one place.
  • Analysis keeps running during SORMAS outages, using the validated line lists.

Next: FAIR data →

FAIR data: record-level data from SORMAS

As part of the SORMAS optimisation, DAVT moved from receiving summary counts to receiving individual, anonymised case records through a new SORMAS API endpoint. This change makes the national surveillance data far more useful, and it follows the FAIR principles: data that is Findable, Accessible, Interoperable and Reusable.

Before: version 1 APINow: record-level API
What DAVT receivedAggregated counts: totals per disease, place and weekIndividual, anonymised case records (one row per case)
Level of detailOnly the breakdowns built into the summaryAny breakdown: age, sex, place, outcome, laboratory result, date
Checking data qualityNot possible below the totalsMissing details, duplicates and inconsistent dates can be found and counted
Comparing with other sourcesTotals onlyCase by case, against line lists and laboratory records
New questionsNeeded a new summary to be built in SORMASAnswered from the same records, without changing SORMAS

How the new feed applies the FAIR principles

Findable

Every record carries a unique case identification (EPID) number and standard fields for disease, place and date, described in the SORMAS data dictionary. Records can be located, linked and counted reliably.

Accessible

Data is retrieved through a documented, authenticated API, not manual exports. Access in DAVT is controlled by role, so national, state and local users see the data they are responsible for.

Interoperable

Records use the harmonised structure of the new disease-specific forms and standard codes for places and diseases, so they can be combined with line lists, laboratory data, DHIS2 and MedSafety.

Reusable

Because the underlying records are kept, the same data serves the weekly report, situation reports, data quality scores, the compliance index and research, with a clear record of where each figure came from.

Detailed analysis, not just totals

With one row per case, analysts are no longer limited to the totals SORMAS chose to send. They can break any disease down by age group, sex, local government area, outcome or laboratory result; work out how many days pass between a person falling ill, being reported and being tested; compare the share of cases who die across groups; and follow a single outbreak week by week. Questions that once needed a new summary built inside SORMAS can now be answered from the records DAVT already holds.

What the record-level data made possible

The new feed became the foundation for IHVN to take DAVT beyond dashboards. Because every module reads the same anonymised records, each new use needed no new data collection, forms or equipment.

Record-level, FAIR case data from SORMAS

One trusted source of individual, anonymised case records, refreshed automatically.

  • Data quality

    Completeness scores for key details such as age, sex and occupation, checks for duplicates and impossible dates, and the evidence used in Surveillance Data Quality Management reviews.

  • Automated reports

    The Weekly Epidemiological Report built straight from live records, and situation reports for any disease generated from SORMAS case data.

  • Surveillance performance

    The National IDSR Compliance Index: a monthly 0 to 100 score for the country, each state and each local government area, including the 7-1-7 outbreak speed target.

  • Advanced analytics

    Statistical tests, disease transmission models, estimates of how many people each case infects, short-term forecasts and “what if” scenarios, run inside DAVT on live data.

The automated Weekly Epidemiological Report and the data quality scores are in use in DAVT. The digital report workflow, automatic situation reports, the compliance index and the advanced analytics suite are built and working, and are awaiting review and adoption by NCDC. See New modules for details.

Safeguards: records are anonymised before they reach DAVT, access is limited by user role, and use of the data is governed by NCDC.

Next: Screenshots →

Results

Faster, more accurate weekly reporting

The Weekly Epidemiological Report is produced automatically from live data, reducing workload for state and national surveillance officers and improving accuracy.

From alert to action

Automatic alerts and the decision tracker give NCDC a record of how each outbreak signal was handled and whether it is pending or resolved.

Surveillance that keeps working

Line-list upload and switching between data sources keep analysis running when SORMAS or the internet is unavailable.

Data from several agencies in one place

Links to DHIS2 and MedSafety support Nigeria’s obligations under the International Health Regulations and a One Health approach, where human, animal and environmental health agencies share data.

From six states to the whole country

After deployment in six IHVN-supported states, DAVT was expanded with NCDC to all 36 states and the Federal Capital Territory in January 2024.

Owned by Nigeria

DAVT is an NCDC platform, with a plan for its maintenance, security and continued development.

Next: New modules →

New DAVT modules built by IHVN

Building on its work on DAVT under SECURE-Nigeria, the IHVN team has designed and built four further modules inside the DAVT platform. They show how DAVT can move NCDC from producing reports by hand to producing them automatically, measuring how well surveillance is working, and analysing outbreaks in depth.

Status: these modules are built and working in the DAVT software, but they have not yet been deployed for use. They are awaiting review and adoption by NCDC. None of them needs new data collection, new forms or new equipment: they use data already in SORMAS and DAVT.

Digital Weekly Epidemiological Report

The problem. The Weekly Epidemiological Report is NCDC’s official weekly summary of epidemic-prone diseases across all 36 states and the Federal Capital Territory. DAVT already shows the figures, but the report itself is still put together by email: disease working groups fill in templates, and the draft passes from person to person before it is approved.

What it does. Turns report production into a single online workflow. A complete draft is created automatically as soon as each week ends, and then passes through the agreed approval steps to publication.

  • A draft with every table, map and chart is ready the Monday after each week closes
  • Ten priority diseases calculated the same way every week, with year-to-date and previous-year comparisons
  • Each disease working group writes only the section for its own disease
  • Approval steps: disease working group, report team, report lead, Office of the Director General, then publication
  • Each published edition is locked as a permanent, versioned record and sent automatically to the distribution list

Automatic disease situation reports

The problem. Situation reports describe how an outbreak of one disease is developing and how the response is going. Today they are built by hand from private spreadsheets rather than from SORMAS, so SORMAS data is under-used and a report can stall when one person is unavailable.

What it does. Generates the figures for a situation report on any disease directly from individual case records in SORMAS, inside a review and approval workflow owned by the disease working group.

  • Works for any disease in SORMAS, keeping the familiar layouts for ten priority diseases, including cholera, Lassa fever, measles, diphtheria, Mpox and yellow fever
  • Case counts, breakdowns by state, age and sex, weekly epidemic curves, trends over several years and deaths by state
  • Drafts are created automatically at the end of each weekly or monthly reporting period
  • Approval steps: disease working group, report lead, NCDC Communications Unit, then publication
  • Because the report comes straight from SORMAS, keeping SORMAS complete and up to date becomes the quickest route to a timely report

National IDSR Compliance Index (NICI)

The problem. Integrated Disease Surveillance and Response (IDSR) is the system Nigeria uses to detect, report and respond to epidemic-prone diseases. Until now, how well it works has been checked only occasionally, through visits, paper checklists and reviews that rarely look below state level.

What it does. Produces one clear monthly score from 0 to 100 for how well disease surveillance is working, for the whole country, each state and each local government area, using only data already in SORMAS.

  • Scorecards rank states and local government areas and show which part of the work is falling behind
  • Checks whether reports come from real, listed health facilities
  • A two-year history shows whether performance is improving
  • Measures outbreak speed against the 7-1-7 target: detect an outbreak within 7 days, report it within 1 day and respond within 7 days
  • Never guesses: where data is missing it says so, and the score improves as gaps are filled
  • A sample national report was produced from February 2026 data to test the index
How the score is made up
What is checkedShare of the score
Cases are reported on time (within 7 days)18%
Every local government area that should report does so18%
Reported cases are investigated18%
Laboratory samples are taken13%
Reports come from registered health facilities13%
Cases are passed up the reporting chain within a day10%
Records are complete and correctly filled in10%
Rating scale
ScoreRating
90 and aboveLevel 5: Excellent
75 to 89Level 4: Strong
60 to 74Level 3: Working
40 to 59Level 2: Basic
Below 40Level 1: Just reacting

Advanced analytics

The problem. DAVT’s dashboards show what is happening. Answering why, how fast a disease is spreading and what may happen next currently means exporting data to separate statistical software, which needs licences and specialist skills and breaks the link to live data.

What it does. Brings statistical analysis, disease modelling and a research workspace inside DAVT, working on the same live national data.

  • Standard statistical tests, such as chi-square tests, t-tests, correlation, survival analysis and odds ratios, plus vaccine effectiveness estimates
  • Seven disease transmission models, with the reproduction number (how many people each case goes on to infect) estimated four different ways
  • Short-term forecasts with uncertainty ranges, and automatic flags for unusually high case counts
  • A “what if” simulator, for example to project the effect of a sudden rise in cases in one state
  • A research workspace that saves each analysis as a fixed, shareable study that can be exported as a PDF
  • No external statistical software or licences needed

Next: Lessons learned →

Lessons learned

  1. DAVT is only as useful as the data behind it. Incomplete data in SORMAS, and several parallel reporting systems, limited its early use by disease working groups and states.
  2. Bringing NCDC’s surveillance data sources together, and improving how completely SORMAS is filled in, unlocks the value of DAVT.
  3. Making DAVT the basis of routine data reviews by disease working groups drives both its use and improvements in data.

Next: Resources and sources →

Products and resources

  • DAVT user guide
  • Indicator metrics framework, defining every measure shown in DAVT
  • Three learning videos: an overview of DAVT; data visualisation; and surveillance reporting using DAVT
  • DAVT infrastructure management plan
  • DAVT sustainability, development and maintenance strategy

Sources

Explore more IRCE research